Visaluzing Data:
Part I
Dr. Mine Dogucu
Review
Data Visualizations
- are graphical representations of data
Data Visualizations
are graphical representations of data
use different colors, shapes, and the coordinate system to summarize data
Data Visualizations
are graphical representations of data
use different colors, shapes, and the coordinate system to summarize data
tell a story
Data Visualizations
are graphical representations of data
use different colors, shapes, and the coordinate system to summarize data
tell a story
are useful for exploring data
Visuals with a Single Categorical Variable
Bar plot


Visuals with a Single Numeric Variable
Box plot

- The horizontal line inside the box represents the median.
- The box itself represents the middle 50% of the data with Q3 on the upper end and Q1 on the lower end.
- Whiskers extend from the box. They can extend up to 1.5 IQR away from the box (i.e. away from Q1 and Q3).
- The points are potential outliers that represent babies with really low or high birth weight.
Histogram
Bin width = 5 ounces

Bin width = 20 ounces

Etymology
histo comes from the Greek word histos that literally means "anything set up right".
gram: comes from the Greek word gramma which means "that which is drawn".
Online Etymology Dictionary
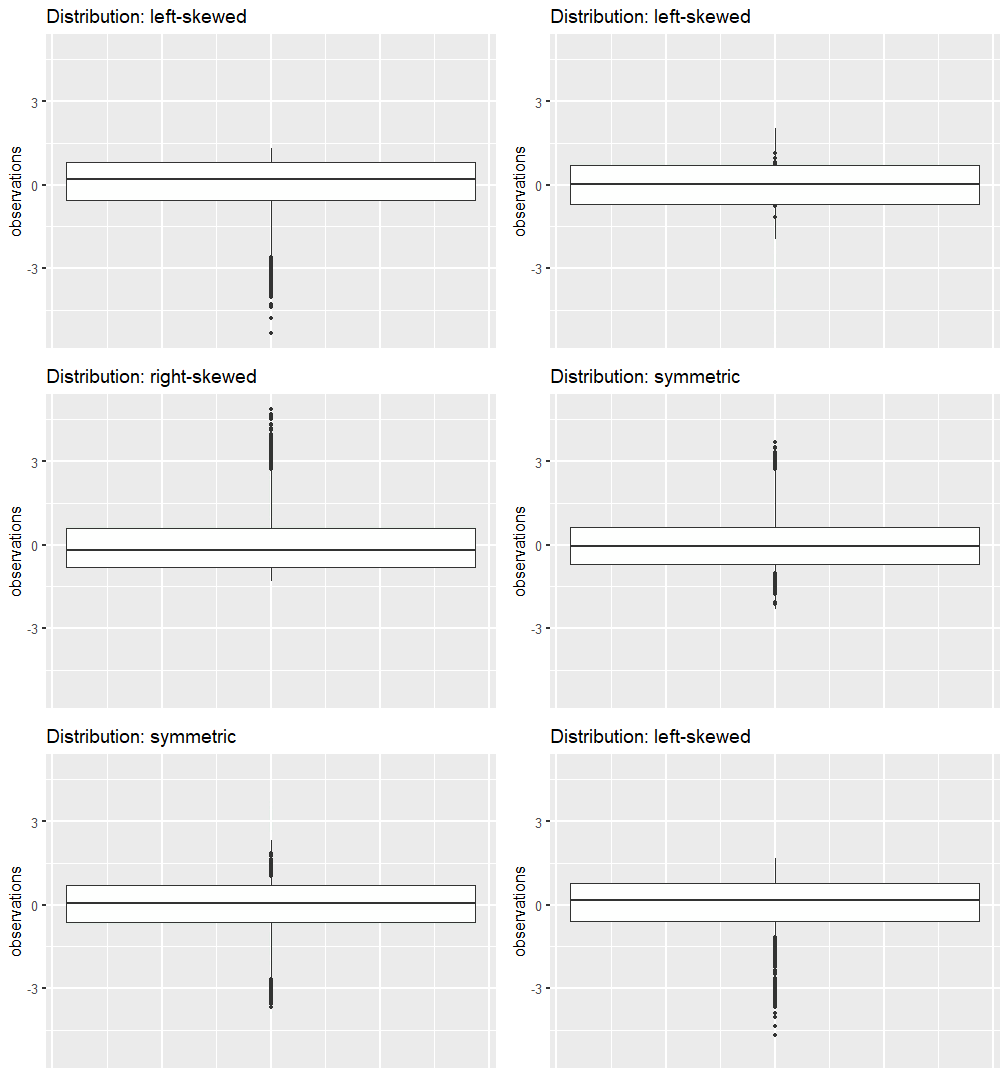
Histogram vs. Boxplot
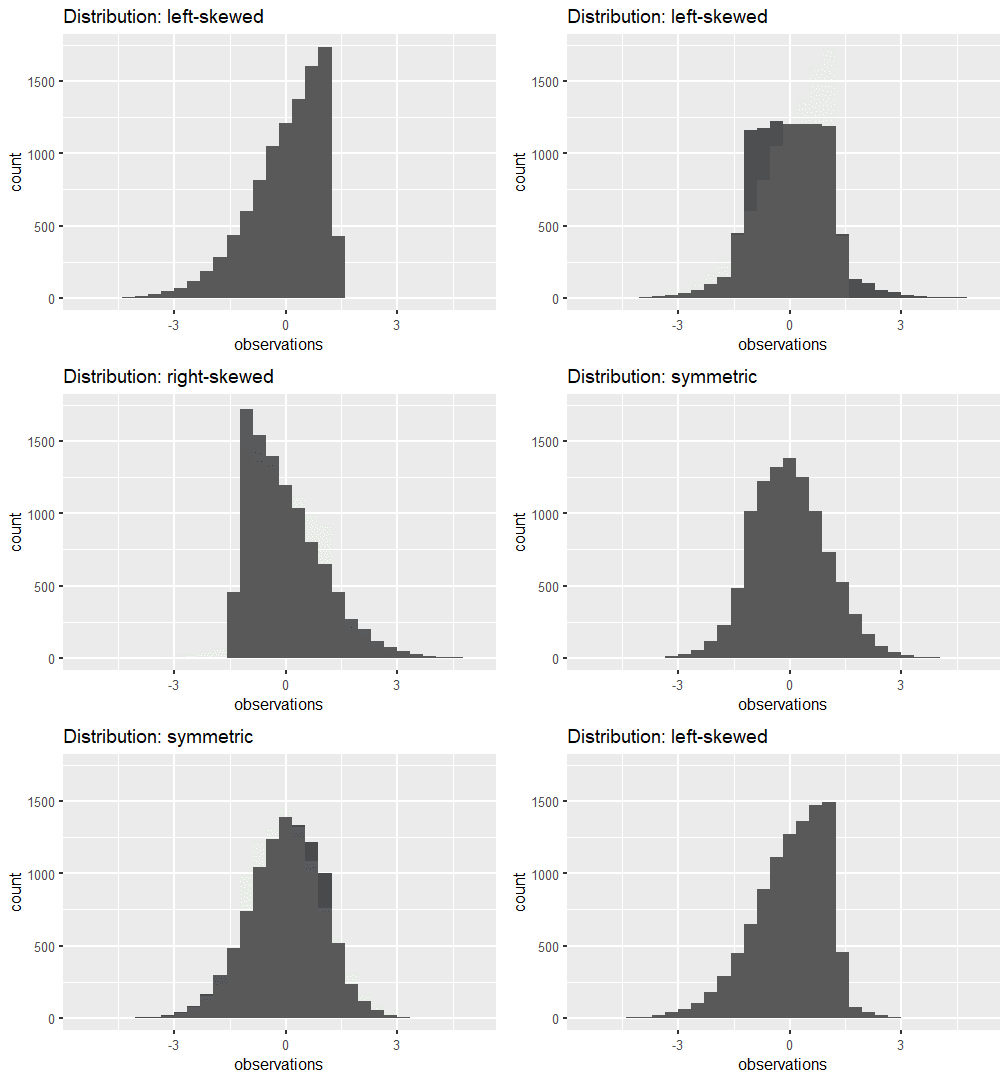
Tail tells the tale.


Note: Violin plots display densities, not counts!


Note: Violin plots display densities, not counts!
Visuals with Two Categorical Variables
Standardized Bar Plot

Dodged Bar Plot

Visuals with a single numerical and single categorical variable.
Side-by-side box plots

Visuals with Two Numerical Variables
Scatter plots

Length of gestation can possibly eXplain a baby's birth weight. Gestation is the eXplanatory variable and is shown on the x-axis. Birth weight is the response variable and is shown on the y-axis.
ggplot is based on grammar of graphics.
Data
glimpse(titanic)Rows: 891Columns: 6$ survived <lgl> FALSE, TRUE, TRUE, TRUE, FALSE, FALSE, FALSE, FALSE, TRUE, TR~$ pclass <chr> "Third", "First", "Third", "First", "Third", "Third", "First"~$ sex <fct> sex, sex, sex, sex, sex, sex, sex, sex, sex, sex, sex, sex, s~$ age <dbl> 22, 38, 26, 35, 35, NA, 54, 2, 27, 14, 4, 58, 20, 39, 14, 55,~$ fare <dbl> 7.2500, 71.2833, 7.9250, 53.1000, 8.0500, 8.4583, 51.8625, 21~$ embarked <fct> Southampton, Cherbourg, Southampton, Southampton, Southampton~The data frame has been cleaned for you.
Visualizing a Single Categorical Variable
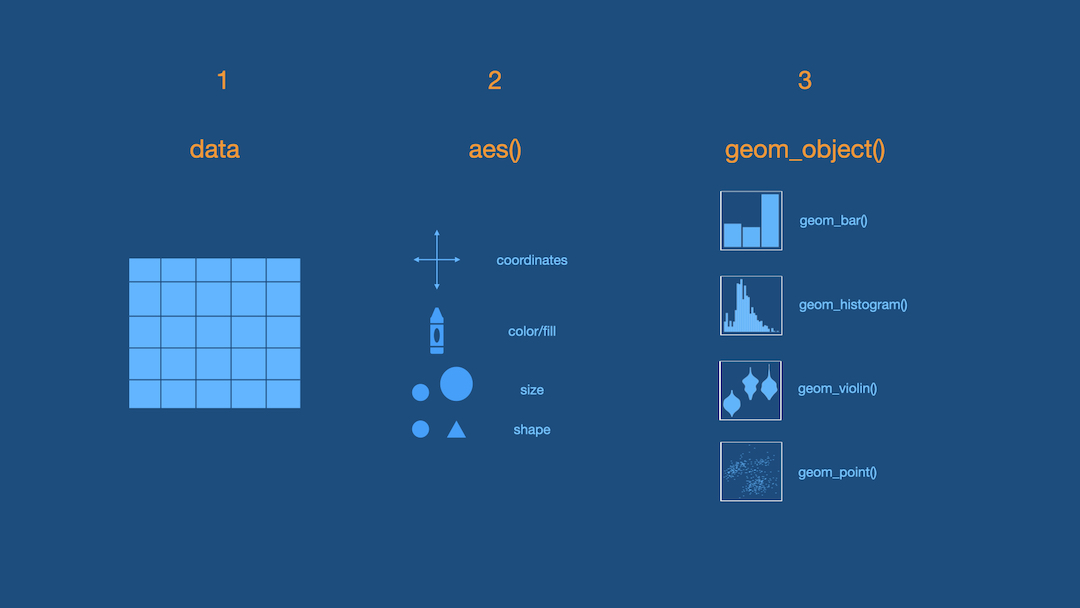
3 Steps of Making a Basic ggplot
1.Pick data
2.Map data onto aesthetics
3.Add the geometric layer
Step 1 - Pick Data
ggplot(data = titanic)
Step 2 - Map Data to Aesthetics
ggplot(data = titanic, aes(x = pclass))
Step 3 - Add the Geometric Layer
ggplot(data = titanic, aes(x = pclass)) + geom_bar()
Visualizing a Single Numeric Variable
Step 1 - Pick Data
ggplot(data = titanic)
Step 2 - Map Data to Aesthetics
ggplot(data = titanic, aes(x = fare))
Step 3 - Add the Geometric Layer
ggplot(data = titanic, aes(x = fare)) + geom_histogram()`stat_bin()` using `bins = 30`. Pick better value with `binwidth`.
What is this warning?
`stat_bin()` using `bins = 30`. Pick better value with `binwidth`.
ggplot(data = titanic, aes(x = fare)) + geom_histogram(binwidth = 15)
ggplot(data = titanic, aes(x = fare)) + geom_histogram(binwidth = 15, color = "white")
ggplot(data = titanic, aes(x = fare)) + geom_histogram(binwidth = 15, fill = "darkred")
ggplot(data = titanic, aes(x = fare)) + geom_histogram(binwidth = 15, color = "white", fill = "darkred")
Visualizing Two Categorical Variables
Stacked Bar-Plot
ggplot(data = titanic, aes(x = pclass, fill = survived)) + geom_bar()
Standardized Bar Plot
ggplot(data = titanic, aes(x = pclass, fill = survived)) + geom_bar(position = "fill")
Note that y-axis is no longer count but we will learn how to change that later.
Dodged Bar Plot
ggplot(data = titanic, aes(x = pclass, fill = survived)) + geom_bar(position = "dodge")
Note that y-axis is no longer count but we will change that later.
New Data
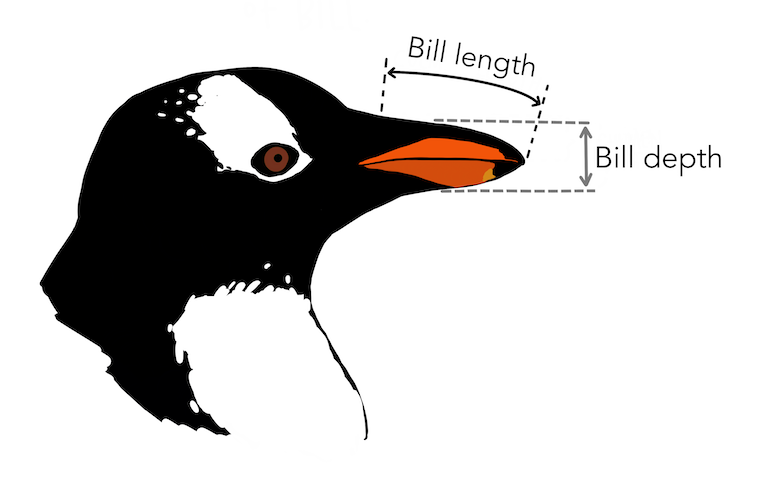
glimpse(penguins)Rows: 344Columns: 8$ species <fct> Adelie, Adelie, Adelie, Adelie, Adelie, Adelie, Adel~$ island <fct> Torgersen, Torgersen, Torgersen, Torgersen, Torgerse~$ bill_length_mm <dbl> 39.1, 39.5, 40.3, NA, 36.7, 39.3, 38.9, 39.2, 34.1, ~$ bill_depth_mm <dbl> 18.7, 17.4, 18.0, NA, 19.3, 20.6, 17.8, 19.6, 18.1, ~$ flipper_length_mm <int> 181, 186, 195, NA, 193, 190, 181, 195, 193, 190, 186~$ body_mass_g <int> 3750, 3800, 3250, NA, 3450, 3650, 3625, 4675, 3475, ~$ sex <fct> male, female, female, NA, female, male, female, male~$ year <int> 2007, 2007, 2007, 2007, 2007, 2007, 2007, 2007, 2007~Visualizing a single numerical and single categorical variable.
Warning: Removed 2 rows containing non-finite values (stat_ydensity).
- Create a ggplot using the
penguinsdata frame. - Map the
speciesto the x-axis andbill_length_mmto the y-axis. - Add a layer of a violin plot.
ggplot(penguins, aes(x = species, y = bill_length_mm)) + geom_violin()Visualizing Two Numerical Variables
ggplot(penguins, aes(x = bill_depth_mm, y = bill_length_mm)) + geom_point()Warning: Removed 2 rows containing missing values (geom_point).
Linear Relationship
ggplot(babies, aes(x = gestation, y = bwt)) + geom_point() + geom_smooth(method = "lm", se = FALSE)
Considering More Than Two Variables
ggplot(penguins, aes(x = bill_depth_mm, y = bill_length_mm, color = species)) + geom_point()Warning: Removed 2 rows containing missing values (geom_point).
ggplot(penguins, aes(x = bill_depth_mm, y = bill_length_mm, shape = species)) + geom_point()Warning: Removed 2 rows containing missing values (geom_point).
ggplot(penguins, aes(x = bill_depth_mm, y = bill_length_mm, shape = species)) + geom_point()Warning: Removed 2 rows containing missing values (geom_point).
ggplot(penguins, aes(x = bill_depth_mm, y = bill_length_mm, shape = species, color = species)) + geom_point()Warning: Removed 2 rows containing missing values (geom_point).
ggplot(penguins, aes(x = bill_depth_mm, y = bill_length_mm, shape = species, color = species, size = body_mass_g)) + geom_point()Warning: Removed 2 rows containing missing values (geom_point).
Practice
Using either the babies, titanic or penguins data frame ask a question that you are interested in answering. Visualize data to get a visual answer to the question. What is the visual telling you? Note all of this down in your lecture notes.


